Graphs in JavaScript with adjacency lists: modeling, neighbors, and a solid setup for BFS and DFS. Working Node.js code.
Jonathan Juliani
Sr Software Engineer - Full Stack · WithClutch Inc. | Juliani Tecnologia
Node.jsJavaScript
Modeling “who connects to whom” with nested objects turns into spaghetti — social graphs, recommendations, and routes need a graph. This episode builds an adjacency list in JavaScript, groundwork for BFS/DFS in ep. 14.
What you'll learn:
Directed vs undirected graphs (and weighted edges)
Graphs are an essential data structure that allows us to represent complex relationships between elements, such as social networks, navigation systems and route optimization. Here we will cover the basics with implementation and a few concepts of graphs in NodeJS/JavaScript.
Hands-on
First The Theory
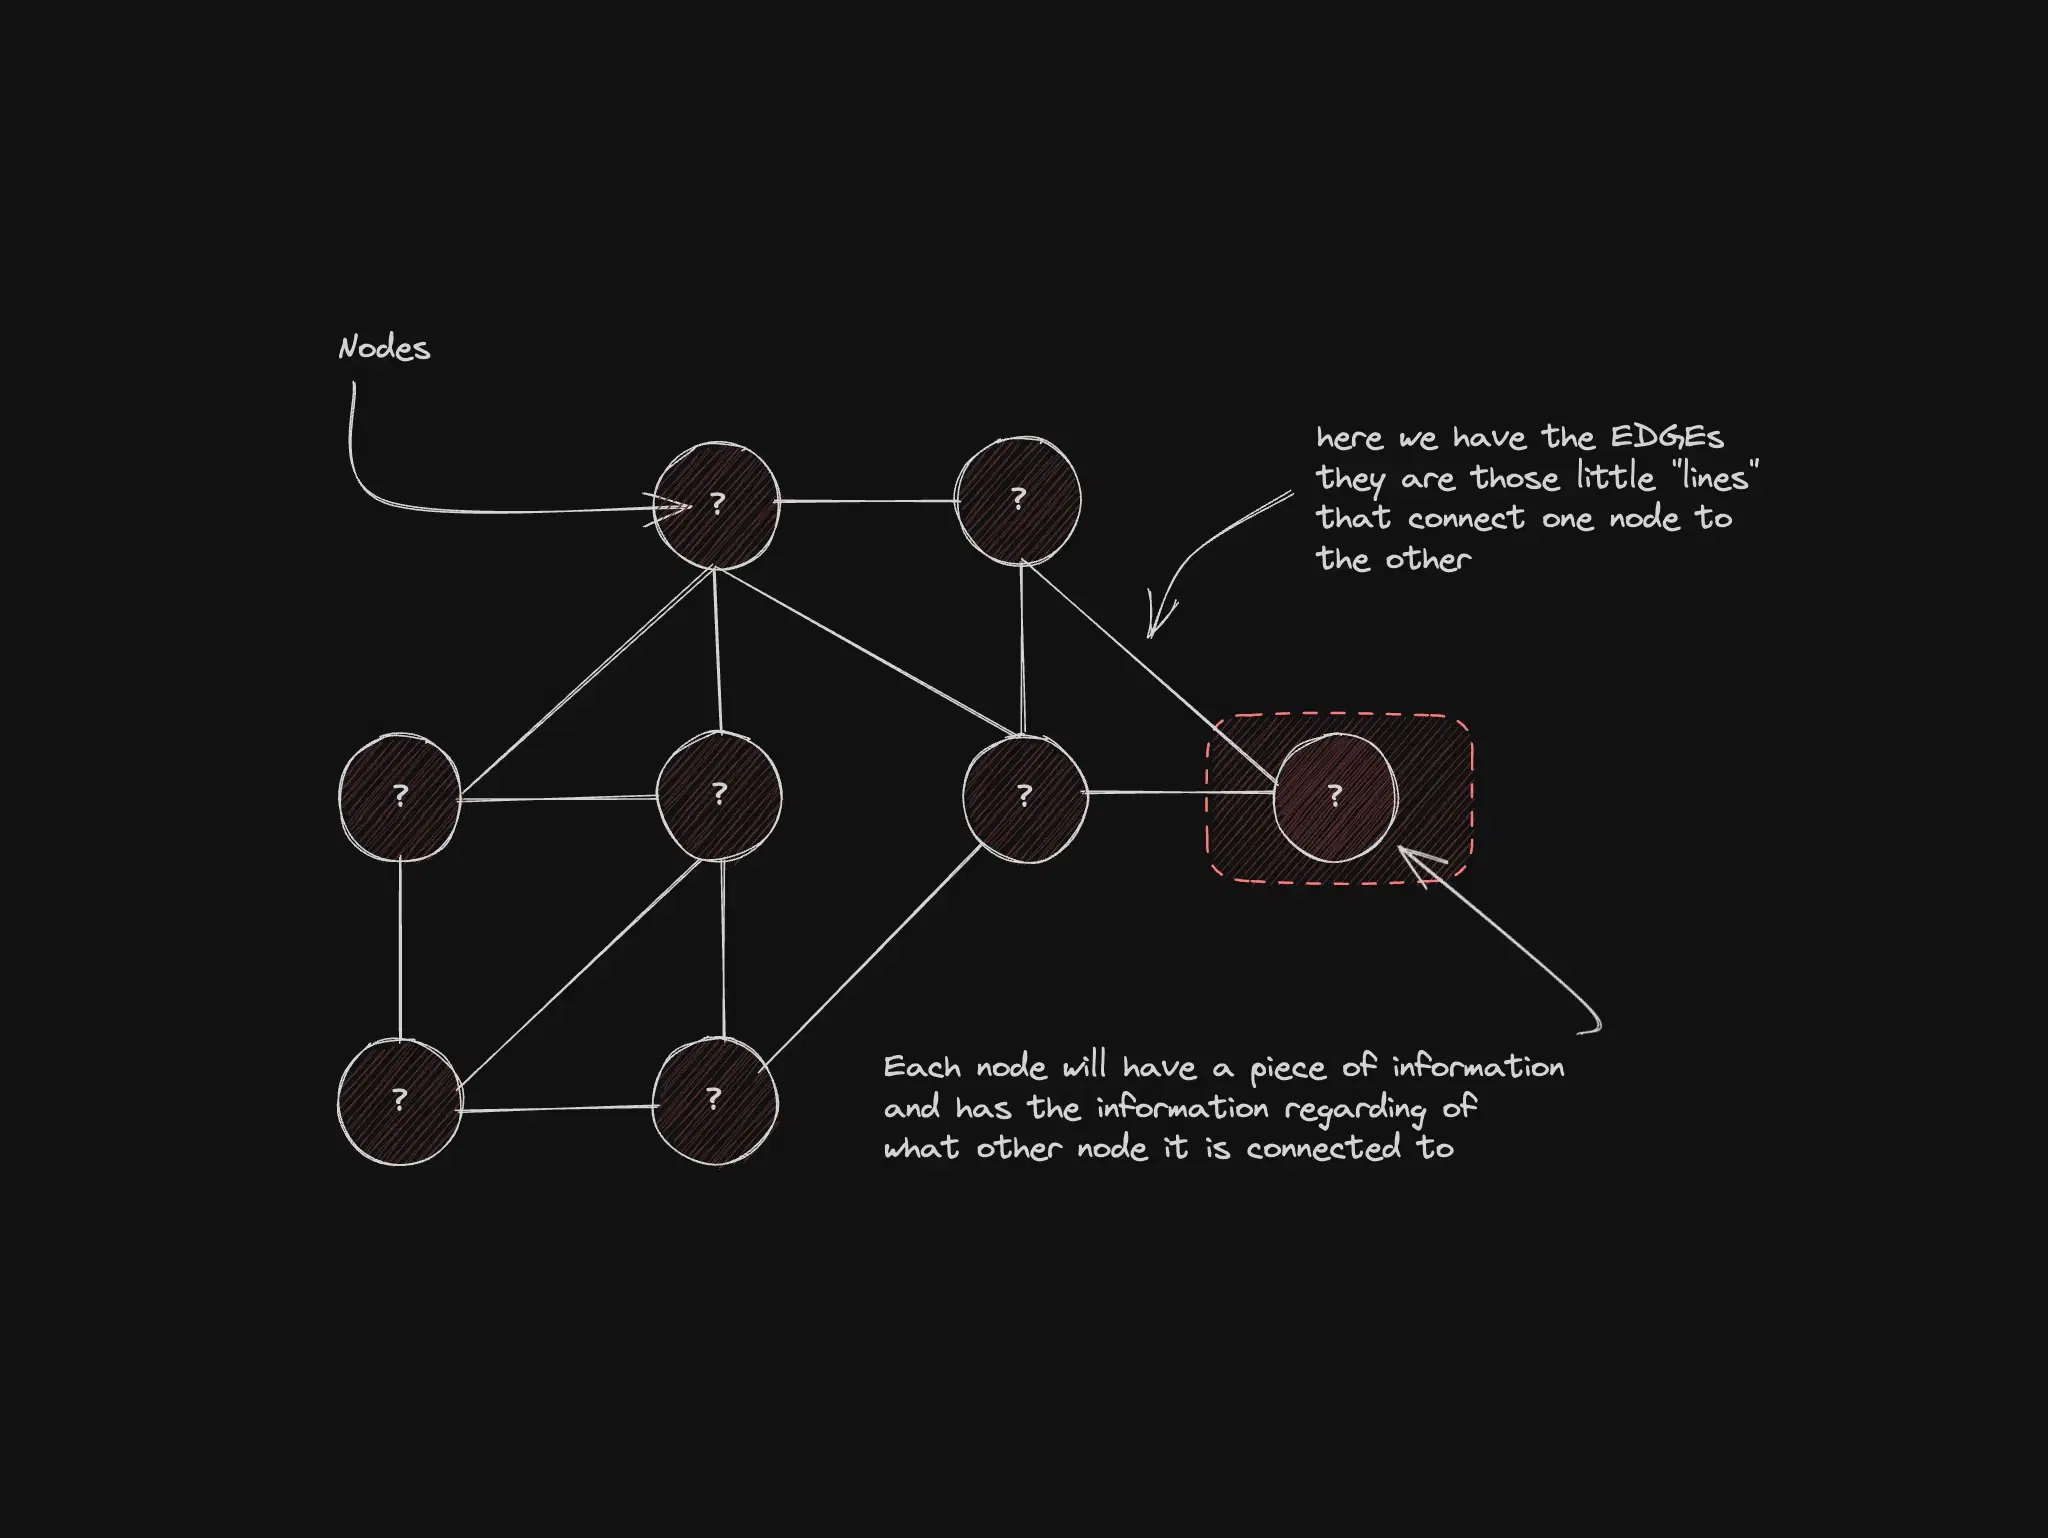
Here you will remember about trees because the graph is a collection of nodes (or vertices) and edges, the edges are the ones that connect these nodes. Graphs can be directed or undirected and can include edges with weights (or other type of information), and when we have that, usually means that the edge has a cost or distance between nodes, and the cost should be considered when navigating through the graph... yes it kind of get a little bit more complex but let's try to simplify this here.
Now The Practice
So, let's dive in the code, the following is a basic graph structure, I mean, what a basic graph should have? It should have its nodes, and it's size:
On the above code the goal is to add items (or nodes) into the graph, but bear in mind that the variable where we are inserting data it's named as adjacentList but it's an object, I know that's a little confunsing now, but the intention here is to keep the names easy for you to identify in other places. So we are adding an object, and when we do adjacentList[node] = [] we are creating a object key inside the adjacentList object, and this key has an empty ([]) value, meaning that it has empty relations/connections.
When we add an Edge we basically are adding a connection between two nodes like a connection between X and Y. That's why we add both ways on the code, we need to add a connection from X to Y and another connection grom Y to X.
We do that because of the type of the graph we are creating is not a directional graph (thats a matter for another post) but keep in mind that we are basically creating a connection that comes and goes from 2 points (like a street). We can also note that in this basic template we are not adding any "weight" to the edges, if we wanna to do that (like in a graph that represents a street and the lenght of the street for instance) we could add the weight doing something like this:
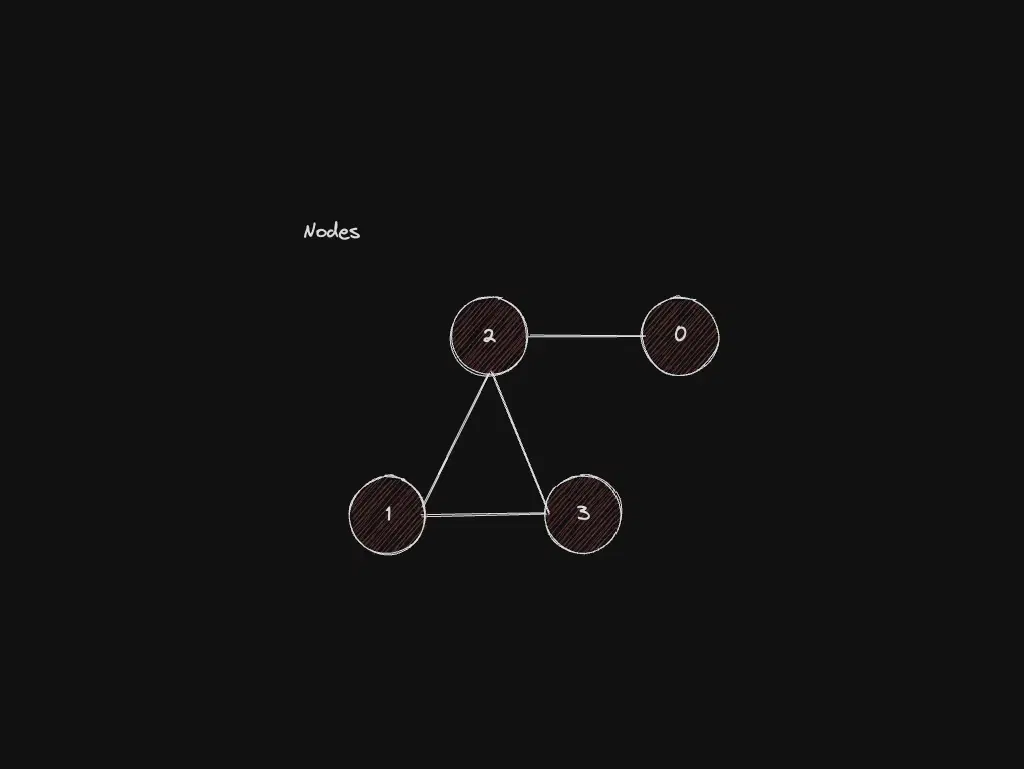
To basically the showConnections function is saying that:
0 has a connection with 2.
1 has a connection with 2 and 3.
2 has a connection with 0, 1 and 3.
3 has a connection with 1 and 2.
Does this information triggers something in your brain?
Edge cases: dense graphs and shift in BFS
Adjacency lists with Map + neighbor arrays suit sparse graphs. Near-complete graphs may be simpler as an adjacency matrix — O(V²) memory, O(1) edge lookup.
In ep. 14 you use queue.shift() for BFS — is that slow? Yes. shift() is O(n) on arrays. For large graphs use a head index or deque; the algorithm stays the same.